








Engineering

Project 04 / 06

Counter-Flow Heat Exchanger CFD Analysis

A two-case thermal study combining ε-NTU calculations with ANSYS Fluent to show how inlet velocity changes residence time, outlet-temperature behavior, flow structure, and total heat-transfer performance in a counter-flow exchanger.

Temperature · full range
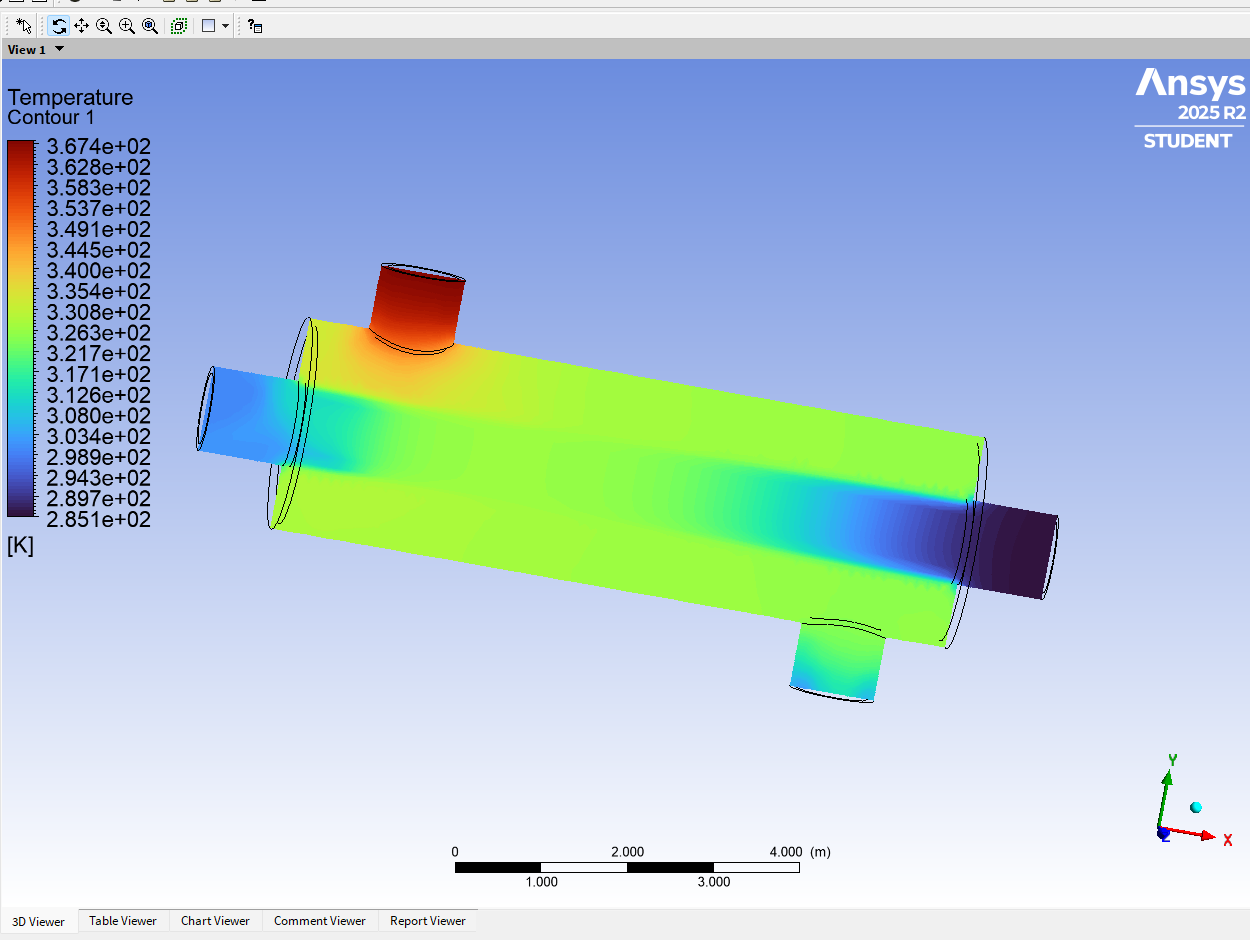
Case A · 0.5 m/sFull-range Case A temperature contour at 0.5 m/s. Colors show local values on the center plane, not a weighted outlet temperature.
ANSYS Fluent full-range temperature contour for Case A at 0.5 meters per second, showing hot shell-side water around the colder counter-flowing central tube.
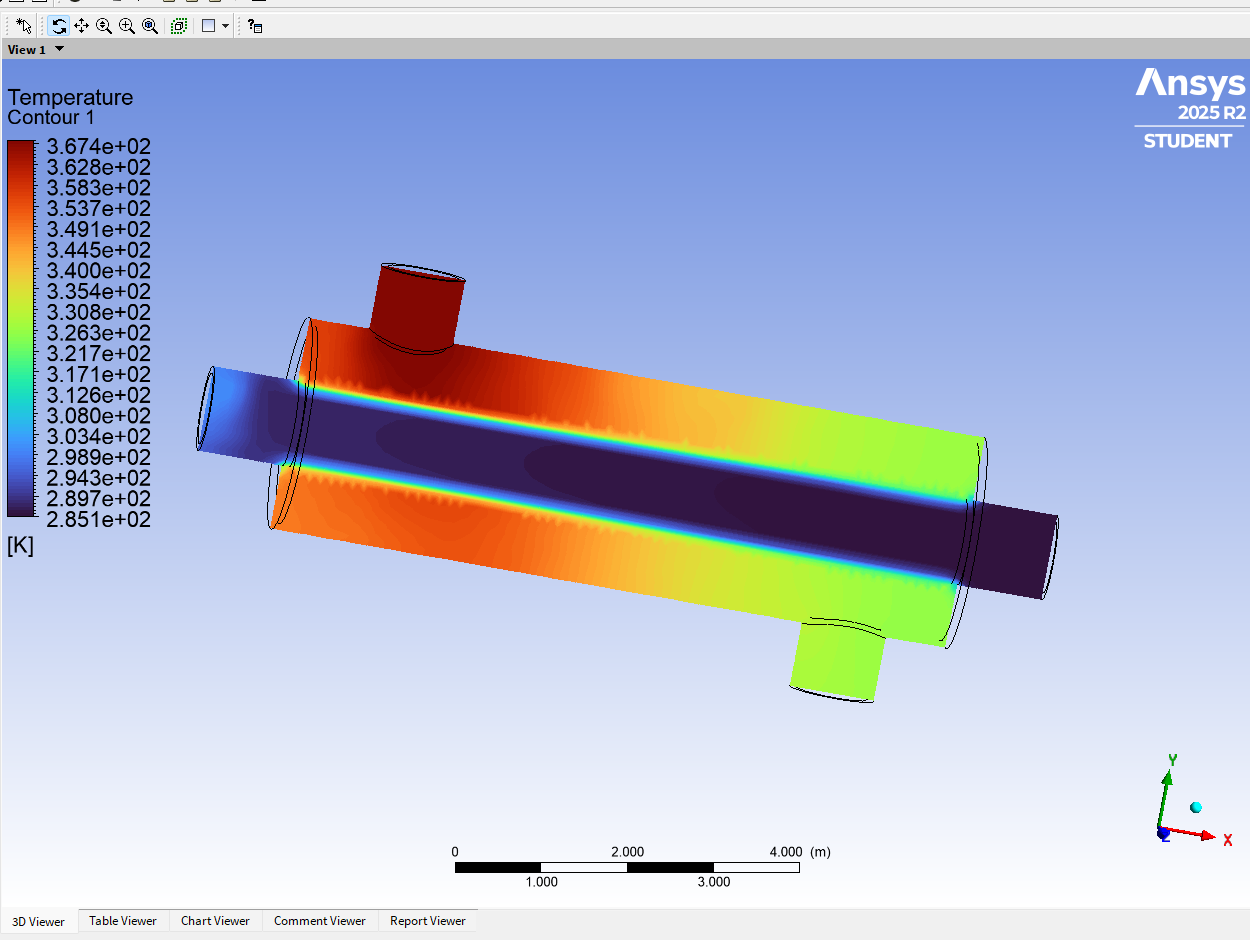
Case B · 0.05 m/sFull-range Case B temperature contour at 0.05 m/s. Colors show local values on the center plane, not a weighted outlet temperature.
ANSYS Fluent full-range temperature contour for Case B at 0.05 meters per second, showing larger local temperature redistribution at the lower velocity.

Lowering inlet velocity increased residence time and produced larger stream temperature changes, while the faster case retained the slightly higher theoretical heat-transfer rate through greater mass flow.

01The engineering question

The study asks how a tenfold inlet-velocity change alters thermal and flow behavior in one counter-flow exchanger geometry.
The project examines a single-tube counter-flow shell-and-tube heat exchanger. Hot water travels through the shell side while cold water moves in the opposite direction through the central tube, transferring heat across the copper tube wall.

Two inlet-velocity conditions are compared: Case A at 0.5 m/s and Case B at 0.05 m/s. The comparison tests how residence time and mass flow affect stream temperature changes and total theoretical heat-transfer rate without treating either case as globally superior.

02Two lenses on the same exchanger

The ε-NTU calculation and CFD simulation describe different scales of the same heat-transfer problem.

The counter-flow ε-NTU method provides simplified bulk-average predictions using stream heat-capacity rates, an assumed overall heat-transfer coefficient, NTU, and effectiveness. ANSYS Fluent complements that model by resolving local, nonuniform temperature, velocity, and static-enthalpy fields.

The two approaches are therefore complementary rather than interchangeable: ε-NTU predicts bulk outlet behavior, while CFD shows how thermal and flow behavior varies through the geometry.

Counter-flow ε-NTU relationship

NTU and the capacity-rate ratio determine counter-flow effectiveness. Effectiveness then scales the maximum possible stream-to-stream heat transfer into the theoretical bulk heat-transfer rate; outlet temperatures follow from stream energy balances.

The smaller of the two stream heat-capacity rates.
The ratio C_min / C_max.
The assumed overall heat-transfer coefficient used by the theoretical model.

The report uses this relationship for both velocity cases; U is an assumption, not a calibrated value.

Theoretical ε-NTU results
CaseVelocityCold outletHot outlet
A0.5 m/s14.34 °C94.55 °C3.85 MW
B0.05 m/s32.27 °C91.14 °C3.33 MW

These are theoretical bulk predictions, not values read from CFD contour colors.

03Building the Fluent model

A consistent Fluent setup makes the two velocity cases comparable while retaining local shell- and tube-side behavior.

Shared model setup

The CFD study was performed in ANSYS Fluent 2025 R2 using the provided single-tube exchanger geometry. Water was assigned to both fluid domains, copper to the shell and tube walls, and the energy equation was enabled.

The simulation used the realizable k-ε turbulence model with scalable wall functions. Results were post-processed on the center plane at z = 0 for temperature, velocity, and static enthalpy through contour and streamline outputs.

  • Case A inlet velocity: 0.5 m/s
  • Case B inlet velocity: 0.05 m/s
  • Hot shell-side inlet: 95 °C
  • Cold tube-side inlet: 12 °C
  • Water in both fluid domains and copper shell/tube walls
  • Energy equation, realizable k-ε, and scalable wall functions
  • Center-plane z = 0 temperature, velocity, and static-enthalpy post-processing

04What velocity changes

The matched fields reveal a residence-time/mass-flow tradeoff rather than one universally superior operating condition.

Both cases transfer heat from the hot shell-side water to the cold tube-side water. The slower Case B condition increases residence time and produces larger stream temperature changes, while Case A's greater mass flow produces the slightly larger theoretical total heat-transfer rate.

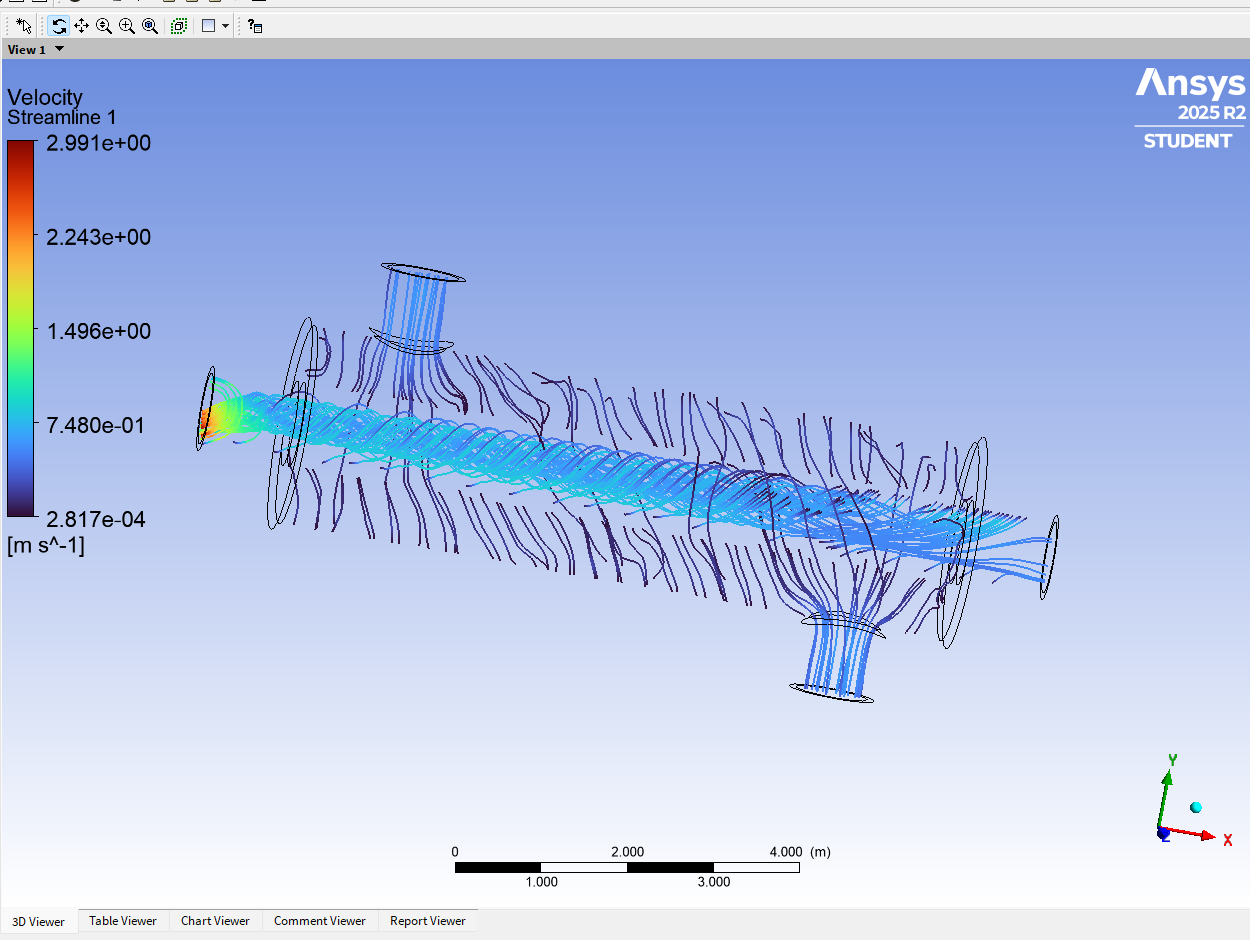
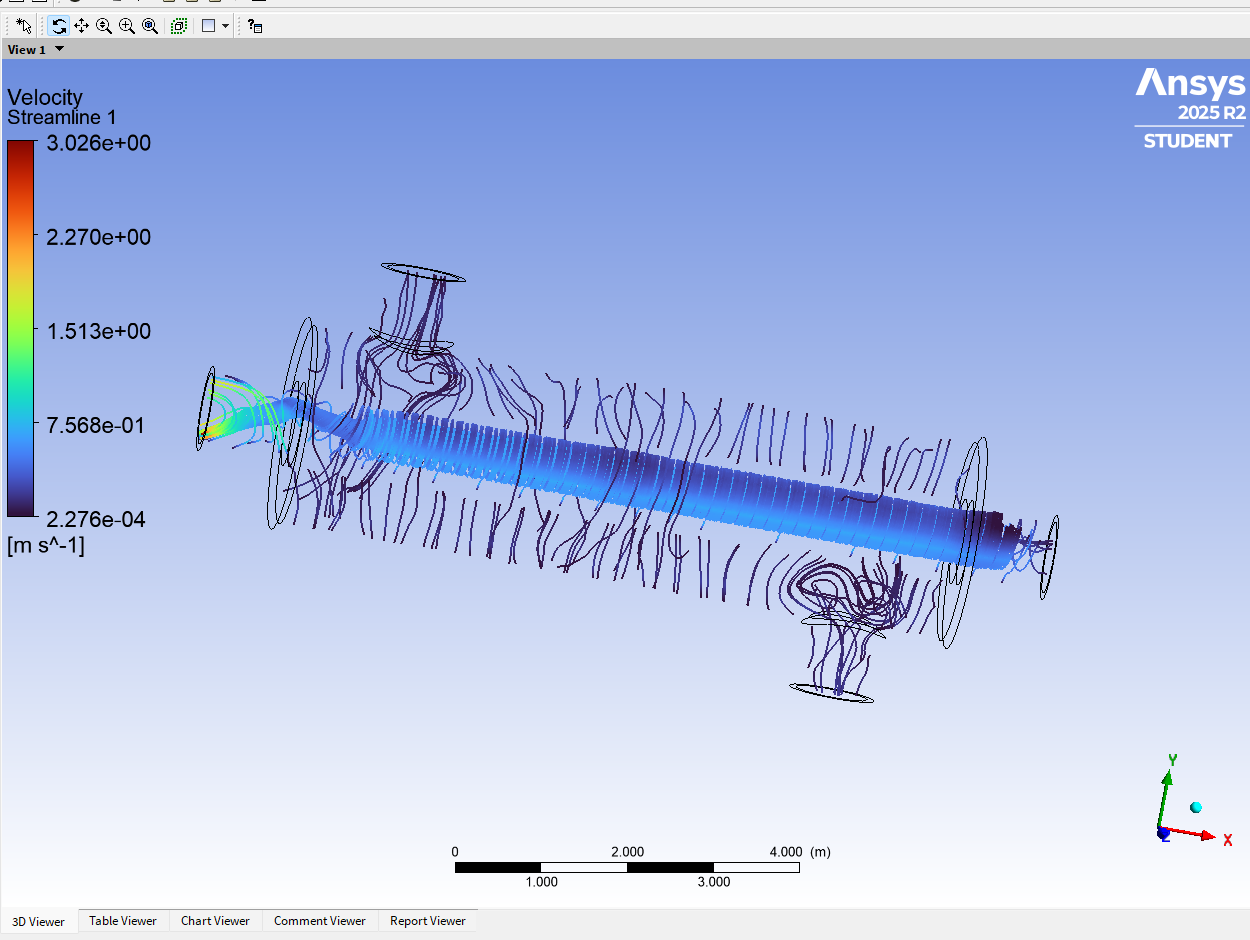
The tube-side flow remains comparatively direct. Shell-side flow is more curved and distributed around the central tube, with flow turning and possible recirculation near the nozzle regions.

Velocity streamlines · full range

ANSYS Fluent velocity streamlines for Case A at 0.5 meters per second, showing direct tube-side flow and curved distributed shell-side paths.
Case A · 0.5 m/s · Velocity streamlines · full rangeCase A velocity streamlines show comparatively direct tube-side flow and distributed shell-side paths with turning near the nozzles.
ANSYS Fluent velocity streamlines for Case B at 0.05 meters per second, showing direct tube-side flow and curved shell-side flow with possible nozzle-region recirculation.
Case B · 0.05 m/s · Velocity streamlines · full rangeCase B velocity streamlines preserve the direct tube path and curved shell flow; turning and possible recirculation remain qualified visual observations.

The lower-velocity case changes stream temperatures more; the higher-velocity case carries the larger theoretical total rate.

Case A · 0.5 m/s

14.34 °C cold / 94.55 °C hot · 3.85 MW

The faster case has smaller theoretical outlet-temperature changes but the slightly higher theoretical total heat-transfer rate because mass flow is greater.

Case B · 0.05 m/s

32.27 °C cold / 91.14 °C hot · 3.33 MW

The slower case has larger theoretical outlet-temperature changes because increased residence time allows more exchange per unit mass.

These emphasized values are theoretical ε-NTU bulk results, not visually estimated CFD outlet temperatures.

05Reconciling bulk predictions with local fields

The apparent theory/CFD differences are useful only when the evidence types and their precision are kept distinct.

The report compares theoretical ε-NTU outlet temperatures with values read visually from center-plane CFD contours. The theoretical values are bulk predictions; the CFD values are approximate local interpretations of nonuniform fields.

Possible causes of difference include the bulk-average theoretical simplification, curved and distributed shell-side flow, possible nozzle-region recirculation, mesh resolution, convergence quality, turbulence modeling, simplified geometry, and the assumed overall heat-transfer coefficient U.

Theory and approximate visual CFD outlet comparison
CaseTheory coldCFD visual coldTheory hotCFD visual hot
A · 0.5 m/s14.34 °C≈ 25 °C94.55 °C≈ 60 °C
B · 0.05 m/s32.27 °C≈ 29 °C91.14 °C≈ 44 °C

Values marked ≈ were estimated visually from local center-plane contour colors. They are not exact, area-weighted, or mass-flow-weighted outlet temperatures and must not be used for percentage-error claims.

06Design implications and honest limits

The study supports design directions and tradeoffs, not a finished optimization or experimentally validated recommendation.

Potential future directions

For the report's lower-temperature design goal, slower Case B is more suitable than Case A because the longer residence time produces greater shell-side cooling. Its visually estimated shell-side outlet of ≈ 44 °C may still require additional cooling, mixing with colder water, or temporary storage before the intended low-temperature use.

The field patterns suggest several future directions for increasing heat transfer, but the report did not simulate or optimize these changes.

  • Use more or longer tubes to increase heat-transfer area and residence time
  • Add fins or other extended surfaces
  • Reduce velocity when larger temperature change is the priority
  • Add shell-side baffles to improve mixing and reduce stagnant regions
  • Improve wall material, thickness, or thermal contact treatment

Those directions trade against pumping power, cost, compactness, and manufacturing complexity. The best design therefore depends on whether the priority is total heat-transfer rate, lower outlet temperature, compact size, or efficient operation.