








Engineering

Project 03 / 06

Reinforcement Learning Thermostat Controller Comparison

Simulated thermal-control study comparing Q-learning, SARSA, DQN, rule-based, and proportional thermostat controllers under standardized conditions for temperature accuracy, energy use, reward, and control stability.

Representative response and evaluation-wide switching
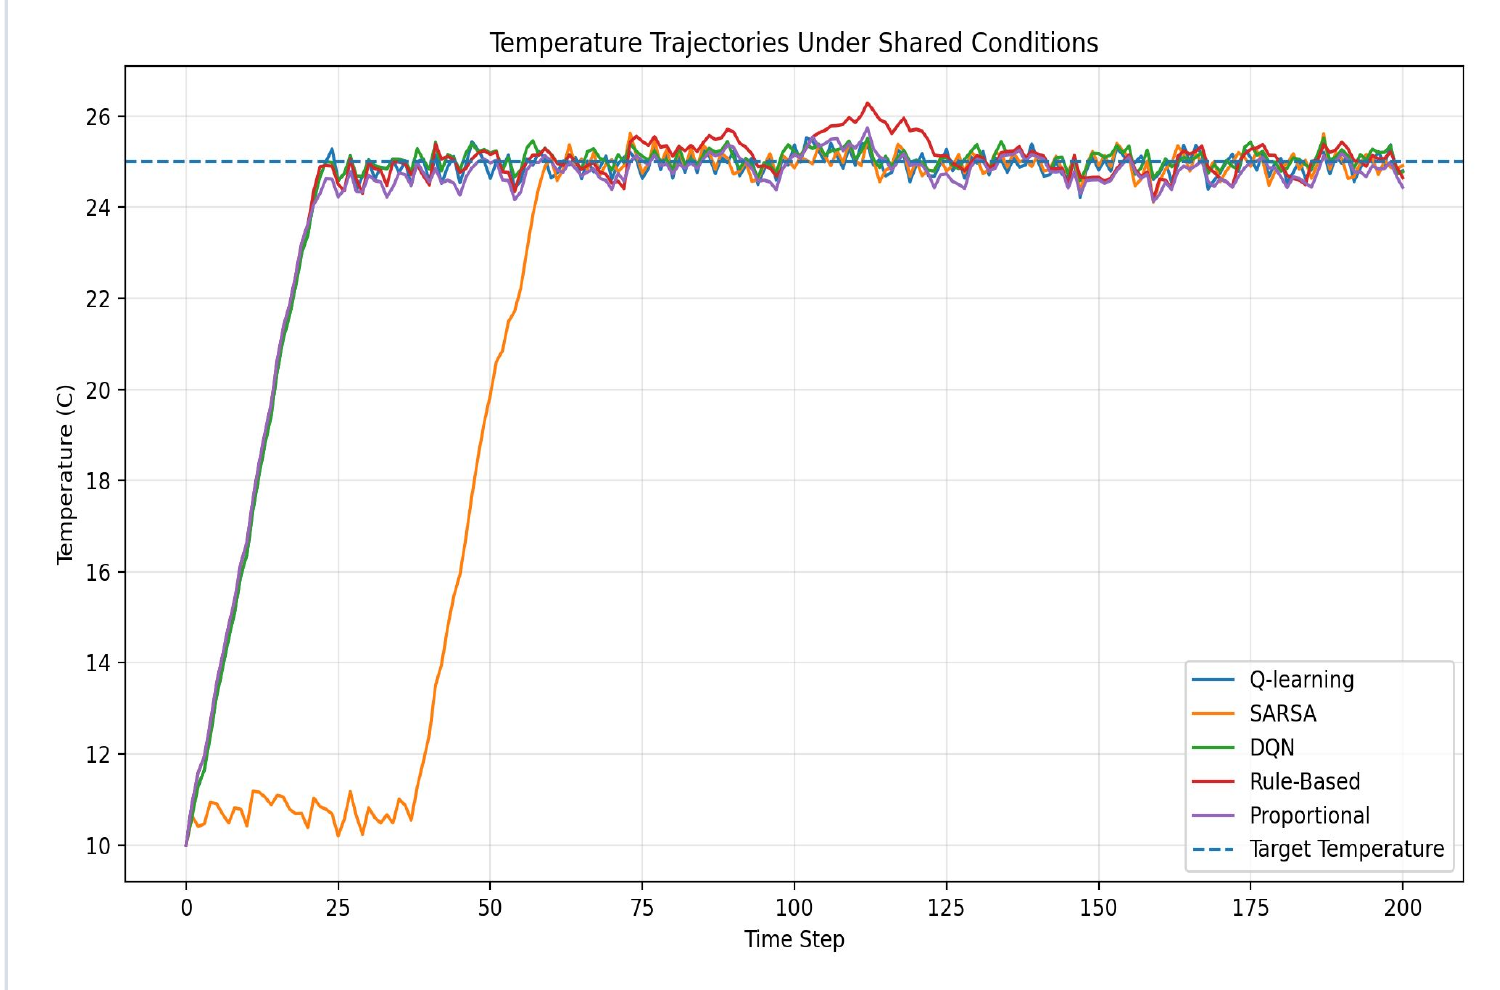
Representative episode · initial temperature 10°C · noise seed 999One representative 200-step evaluation episode from a shared 10°C initial condition and noise sequence. The traces show different warm-up paths toward the 25°C target; averaged results come from 100 episodes.
Temperature trajectories for Q-learning, SARSA, DQN, rule-based, and proportional controllers during one shared 200-step simulated episode, with a 25 degree Celsius target line.
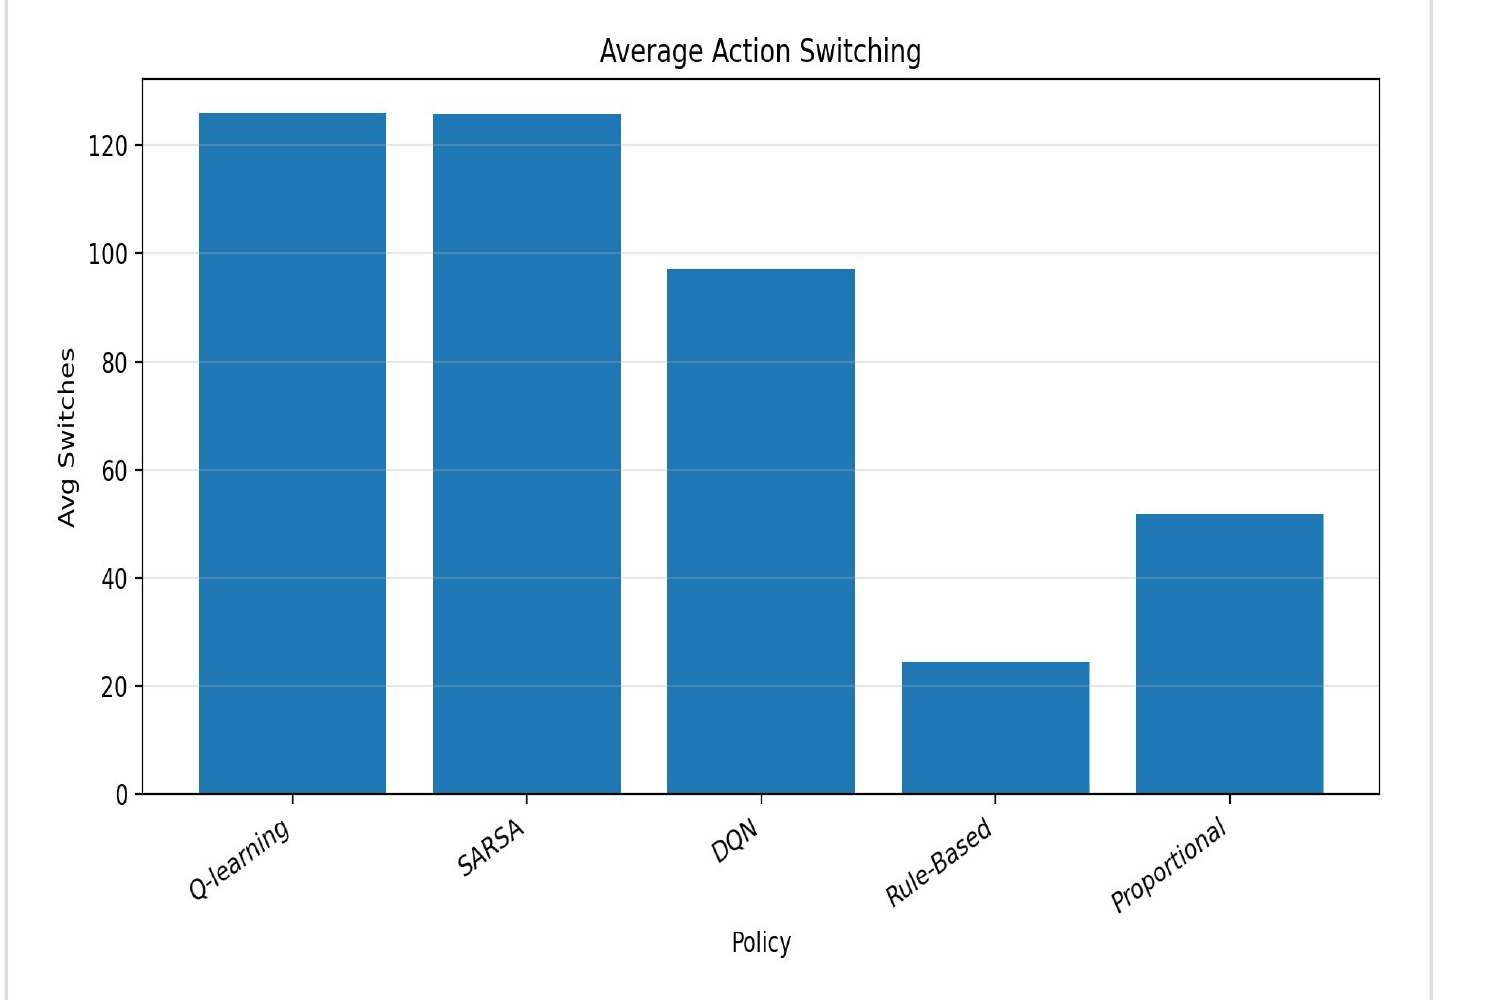
100 matched evaluation episodes · descriptive meanMean action changes per 200-step episode across 100 matched evaluations. Every learned controller switched more often than the two traditional baselines.
Bar chart of mean action changes per 200-step episode for Q-learning, SARSA, DQN, rule-based, and proportional controllers, with all three learned controllers above both traditional baselines.

Across 100 matched simulated evaluations, DQN recorded the highest mean reward (-86.05) and lowest mean temperature error (0.408°C) under the documented reward, but the learned controllers averaged 97.13–126.00 action changes per 200-step episode versus 24.33–51.81 for the two traditional baselines.

01A controlled thermostat comparison

Multiple thermostat policies are evaluated in one standardized simulation so tracking, control effort, reward, and switching can be compared on common terms.
The team compared three trained reinforcement-learning policies—Q-learning, SARSA, and DQN—with Rule-Based and Proportional fixed controllers in one simplified single-zone room model. Off and High were retained as non-practical reference bounds rather than candidate thermostat designs.

The comparison records mean reward, absolute temperature error, normalized control effort, and action switching. Those measures answer different questions: tracking a setpoint closely does not by itself establish quiet control action, low real-world energy use, or deployment readiness.

02The model defines the claim boundary

The shared plant, action space, and reward define both the fairness and the limits of the controller comparison.

At each simulated step, room temperature changes through the selected normalized HVAC action, heat exchange with a fixed 22°C environment, and Gaussian disturbance noise. Every controller chooses from the same five actions, spanning strong cooling to strong heating: -1, -0.5, 0, 0.5, and 1.

The reward penalizes absolute deviation from the 25°C target and adds 0.1 times action magnitude. It contains no penalty for changing actions, which matters when the final switching counts are interpreted later.

Documented simulated plant and reward

The first relation is the common single-zone temperature update. The second is the project-specific reward: temperature error and normalized action magnitude are penalized, while action switching is not.

Simulated room temperature at the current step.
One of five normalized cooling/heating actions.
Fixed simulated ambient temperature, 22°C.
Simulated target temperature, 25°C.
Gaussian disturbance with mean 0 and standard deviation 0.2.

The final standardized model uses α = 0.6 and β = 0.015. The source assigns no physical duration to a step and no physical units to these coefficients or normalized actions.

Final standardized simulation parameters
QuantityDocumented valueInterpretation boundary
Target / ambient25°C / 22°CFixed simulated temperatures
Response α / loss β0.6 / 0.015Source-defined coefficients; no physical units assigned
NoiseGaussian μ = 0, σ = 0.2Simulated disturbance, not a calibrated sensor model
Actions[-1, -0.5, 0, 0.5, 1]Normalized cooling-to-heating levels
Temperature range10–40°CInitial-state and tabular-discretization range
Episode horizon200 stepsNo physical time per step is documented

The modeled action magnitude is unitless normalized control effort—not kW, kWh, electrical consumption, or operating cost.

03Five controllers, two reference bounds

Three learned policies and two fixed traditional baselines form the main comparison; Off and High provide context at the extremes.

Q-learning and SARSA learn tabular action values from current temperature discretized into 50 bins across the documented 10–40°C range. DQN instead maps one normalized continuous-temperature input to five action-value estimates; the source does not preserve its layers, activations, optimizer, replay settings, target-network schedule, batch size, or learning rate.

The fixed controllers require no training. Rule-Based applies full heating below 24.5°C and otherwise selects no action. Proportional maps five documented temperature-error bands to the same five actions. Off always selects zero and High always selects maximum heating, so they remain contextual bounds rather than practical controllers.

Controller taxonomy and documented operation
PolicyTypeState / ruleTraining status
Q-learningTabular off-policy RLCurrent temperature · 50 bins over 10–40°CTrained
SARSATabular on-policy RLCurrent temperature · 50 bins over 10–40°CTrained
DQNNeural action-value RLOne normalized continuous-temperature input · five outputsTrained
Rule-BasedTraditional fixed logic+1 below 24.5°C; otherwise 0Not trained
ProportionalTraditional fixed logicFive temperature-error bands mapped to the common actionsNot trained
OffReference boundAlways 0Not trained
HighReference boundAlways +1Not trained

Off and High are non-practical reference bounds. No undocumented DQN architecture detail or bin width is inferred.

04Train first, compare on matched episodes

Policy learning and controller evaluation are separate stages with different counts and evidentiary meaning.

Q-learning, SARSA, and DQN each trained for a fixed 2,000 episodes of 200 steps in the common environment. The documented shared settings include discount γ = 0.95, epsilon-greedy exploration from 1.0 with decay 0.995 and minimum 0.05, and a 0.1 learning rate for the two tabular methods. The source does not document a DQN learning rate or formal convergence criterion.

After training, all seven policies were evaluated over 100 new simulated episodes of 200 steps. Evaluation seed 12345 generated matched initial temperatures and noise sequences for every controller, making the within-simulation comparison consistent without establishing a held-out environment, independent training repeats, or out-of-sample generalization.

Training and evaluation are distinct stages
StagePoliciesDocumented protocolClaim boundary
TrainingQ-learning, SARSA, DQN2,000 episodes × 200 steps · base seed 42One fixed schedule; no formal convergence or multi-seed study
EvaluationAll five controllers + Off / High100 matched episodes × 200 steps · seed 12345Descriptive means in the same model family; not a held-out test

The 100 evaluation episodes are not 100 independently trained models. Per-episode standard deviations and confidence intervals were not preserved.

05Accuracy and control effort are different questions

The final means expose a tradeoff that a single winner label would hide.

Five-controller evaluation means

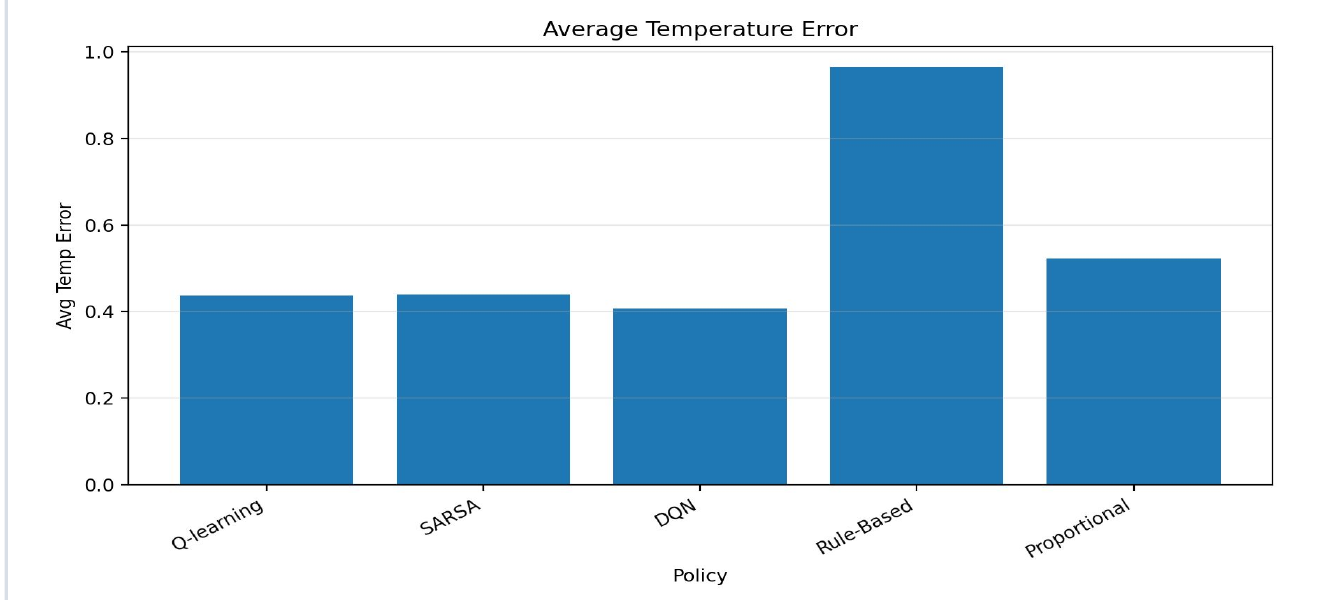
Bar chart comparing mean absolute temperature error for Q-learning, SARSA, DQN, rule-based, and proportional controllers over 100 simulated evaluation episodes.
Average absolute temperature error · °CMean absolute deviation from the 25°C target across 100 matched evaluation episodes. Exact values appear in the semantic table below.
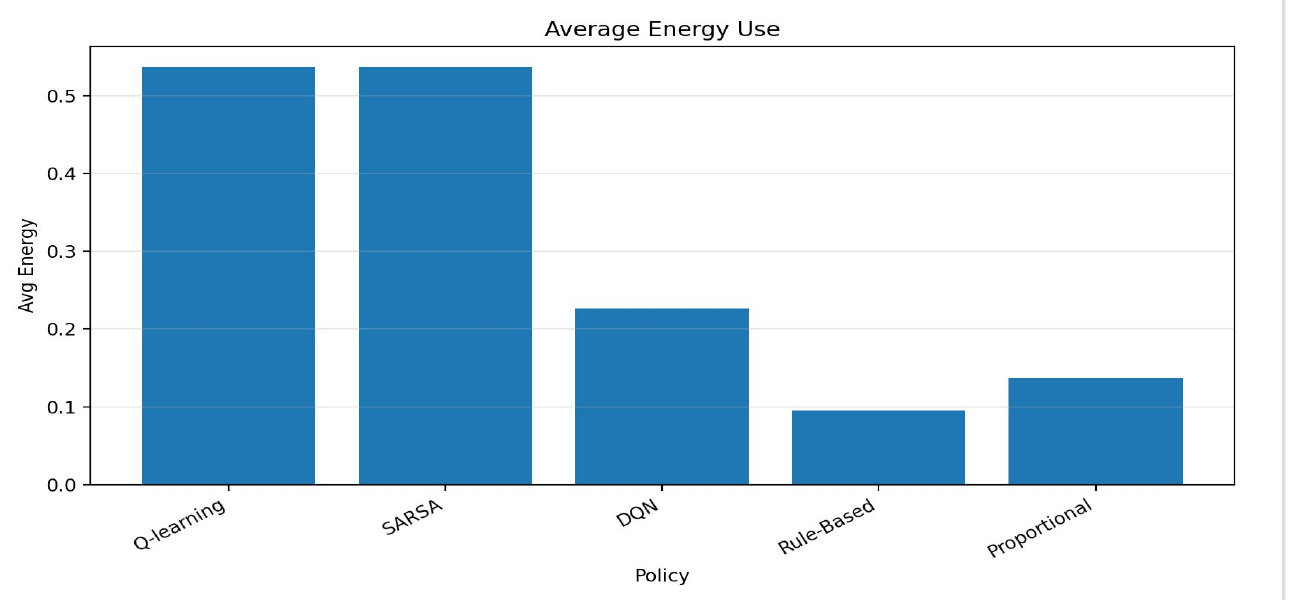
Bar chart comparing mean normalized action magnitude for Q-learning, SARSA, DQN, rule-based, and proportional controllers over 100 simulated evaluation episodes.
Average normalized control effort · unitlessMean normalized control effort, calculated as action magnitude |u_t|, across 100 matched episodes. Despite the source figure title, this is not physical energy use.

DQN recorded the lowest mean temperature error among the five main controllers, while both traditional baselines used less normalized control effort and switched less often.

Final standardized seven-policy evaluation means
PolicyRewardError (°C)Normalized effortSwitches / 200 steps
DQN-86.050.4080.22797.13
Q-learning-97.980.4360.537126.00
SARSA-98.670.4400.537125.87
Proportional-107.310.5230.13751.81
Rule-Based-194.970.9650.09524.33
Off (reference)-704.473.5220.0000.00
High (reference)-5093.3225.3671.0000.00

Values are computed descriptive means across 100 matched simulated episodes. Reward is specific to the documented objective; normalized effort is unitless; no variance or significance result is available.

DQN within the documented objective

-86.05 reward · 0.408°C mean error

DQN produced the highest mean reward and lowest mean absolute temperature error in the final standardized evaluation.

This is the report's strongest result under its reward structure, not statistical or universal controller superiority.

Strongest reported traditional baseline

Proportional · 0.523°C error · 0.137 effort

Proportional control accepted higher mean error than DQN while using less normalized control effort and changing action less often.

Normalized effort is a simulated action-magnitude metric, not electrical consumption.

No confidence intervals, statistical-significance test, robustness study, or real-building measurement is documented.

Q-learning and SARSA tracked the target closely in mean error, but each used 0.537 normalized effort and averaged about 126 action changes per episode. DQN reduced both values relative to the tabular methods, yet still changed action substantially more often than either traditional baseline.

The Off and High rows make the reference bounds explicit without compressing the five-controller charts. Zero action does not hold the target in this model, while constant maximum heating performs poorly under the same reward.

06Switching sets the deployment boundary

Frequent simulated action changes reveal an objective gap that must be addressed before physical-device claims are possible.

Q-learning and SARSA averaged 126.00 and 125.87 action changes per 200-step episode; DQN averaged 97.13. Proportional and Rule-Based control averaged 51.81 and 24.33. These are simulated action-count observations, not measured hardware cycles, wear, instability, or maintenance cost.

Because the documented reward penalizes temperature error and action magnitude but not action changes, the switching result identifies a missing objective. Adding a switching penalty, weather-driven inputs, multi-zone physics, hardware constraints, and physical testing remain future work rather than completed iterations.

Learned controllers

97.13–126.00 switches / 200 steps

All three learned policies changed action more often than both traditional baselines in the final evaluation means.

The model defines no physical time per step, so these values cannot be converted to equipment cycles per hour.

Traditional baselines

24.33–51.81 switches / 200 steps

Rule-Based and Proportional control changed action less often while accepting higher mean temperature error than DQN.

The comparison does not establish hardware friendliness, safety, or physical stability.

Cooper's documented role focused on validation and documentation: organizing the standardized evidence, figures, metrics, validation write-up, and final narrative. Controller implementation, simulation development, training code, and baseline implementation remain team-level or other named contributors' work rather than Cooper-specific claims.